
Neighborhoods in Paris
Paris is 2.1 million people inside the Périphérique, in 105 km², which makes it one of the densest cities in Europe and explains most of what follows: the flat above a shop is the normal home, a lift is a luxury in a 19th-century building, and which floor you are on and which way you face decides what August feels like more than the arrondissement does. The city is administratively twenty arrondissements, but nobody lives in an arrondissement the way they live in a quartier, so the seven districts here are built from the city's own 80 quartiers administratifs and every figure on the page is computed inside those boundaries rather than borrowed from the arrondissement around them. Two facts shape a move more than the rent does. Paris caps rents by law, street by street, and publishes the ceiling, so a listing above it is not merely expensive but unlawful, and knowing that is worth real money to a newcomer. And the spread between districts is the widest of any city on this site: the median disposable income in Belleville is 22,235 EUR a year against 39,150 in Saint-Germain-des-Prés, a fifteen-minute journey apart. These profiles walk you through its neighborhoods: how far the shops are, how the metro commute runs, what a home costs and what people quietly complain about.
Guides for Paris
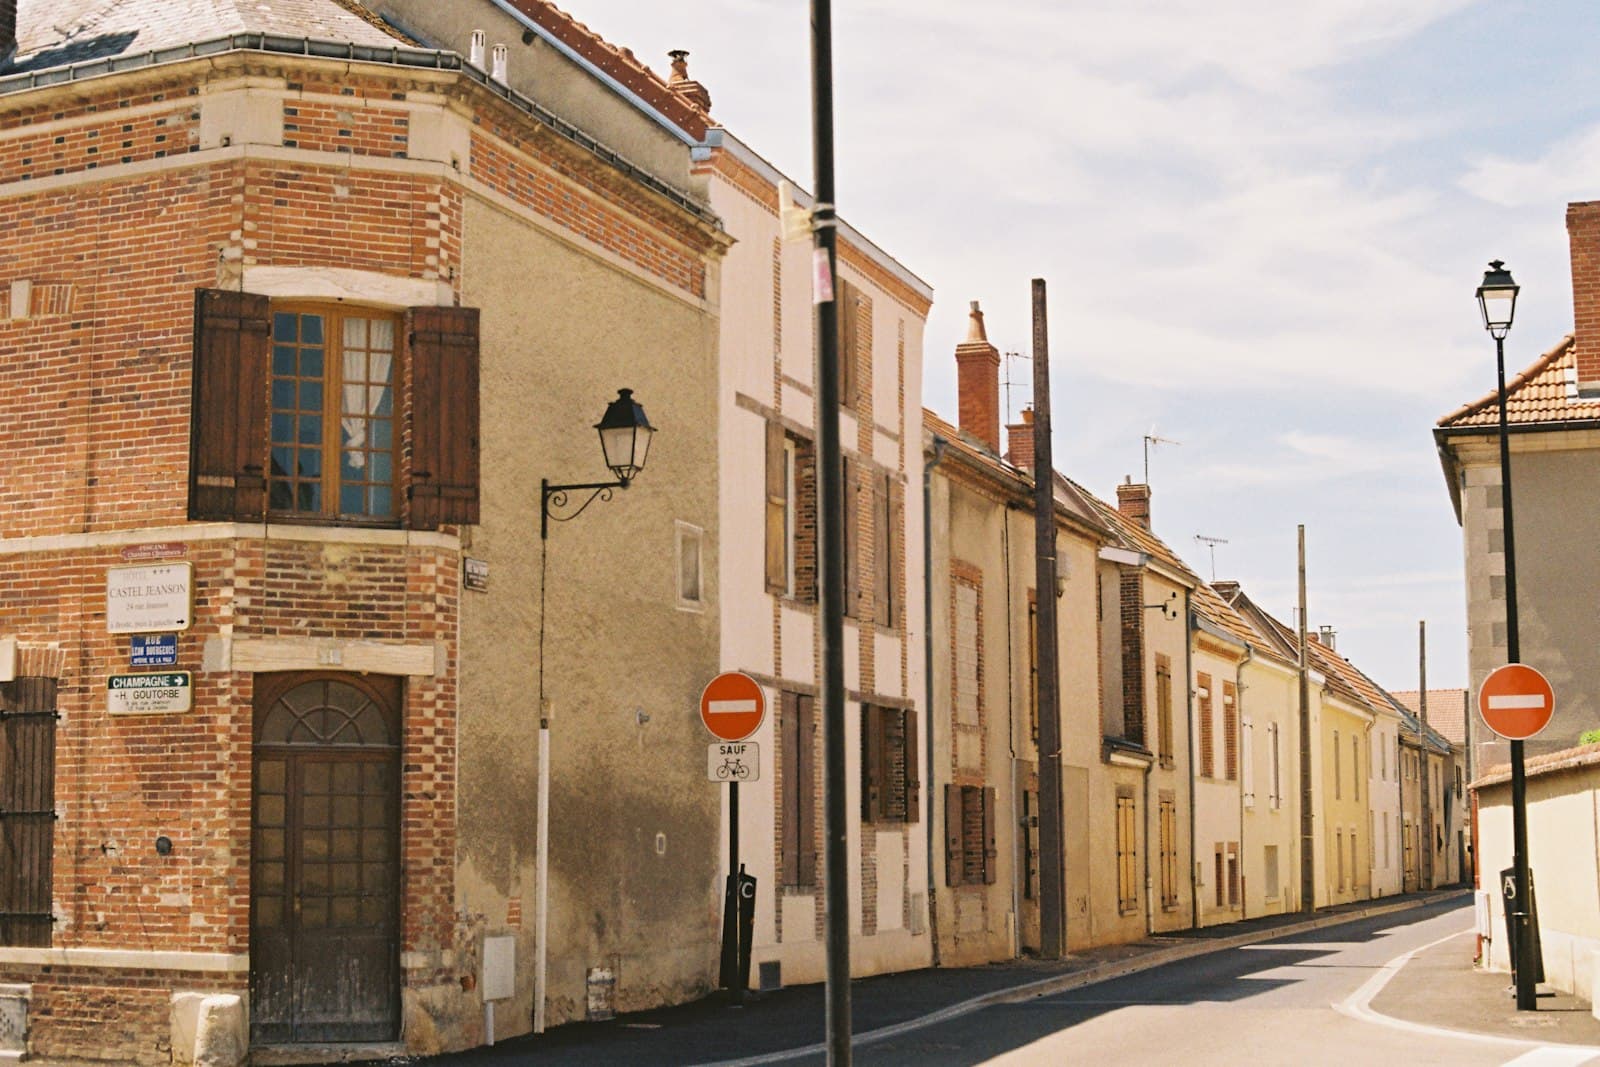
The best neighbourhoods in Paris for families and first-time buyers, arrondissement by arrondissement
Eight Paris neighborhoods for families and first-time buyers: who each suits, how school sectors work, metro lines, parks, notaires' prices per m² and the honest downsides.

Property prices in Paris: what a home really costs in 2026
An honest guide to property prices in Paris: what a home costs, how prices vary by neighbourhood, what moves them, and how to check a specific home's value.

How much is my home worth in Paris? What moves values up and down
Find out what your home in Paris is really worth: how local valuations work, what pushes values up and down, and how to get an honest, independent number.
Buying an apartment in Paris from abroad: a step-by-step guide
A practical guide to buying an apartment in Paris as a non-resident: the rules, the taxes and fees, mortgages, and how to value a home from a distance.

Selling your home in Paris: how to price it right
How to sell your home in Paris for the best honest price: setting the right asking price, presenting it well, and negotiating from evidence.
Common questions about Paris
Which neighborhoods in Paris does Apraiz cover?
Apraiz has 7 neighborhood profiles for Paris: Batignolles, Belleville, Canal Saint-Martin, Latin Quarter, Le Marais, Montmartre and Saint-Germain-des-Prés. Each one covers getting around, everyday shopping, schools, cost of living and the honest downsides.
Which Paris neighborhood has the highest Apraiz Living Score?
Le Marais, at 87 out of 100, followed by Latin Quarter at 87. The Living Score is a weighted mean of walking, getting around, everyday shopping, schools and quality of life. Cost of living is shown separately and is not part of it.
How safe is Paris?
Paris is a street-theft city, and that sentence is more useful than any single safety score. Theft from the person runs at 451.2 per 10,000 residents a year against 91.0 across France, five times the national rate, and unarmed robbery at 34.5 against 7.2. So the risk a resident actually meets is to their pockets in a crowd, on the metro and around the stations, rather than to their home or their person.
Safety and crime in Paris
Paris is a street-theft city, and that sentence is more useful than any single safety score. Theft from the person runs at 451.2 per 10,000 residents a year against 91.0 across France, five times the national rate, and unarmed robbery at 34.5 against 7.2. Then the shape changes: home burglary is 5.1 per 1,000 dwellings against a national 5.6, slightly below the national rate, and physical violence inside the family is 29.8 against 37.6, below it. So the risk a resident actually meets is to their pockets in a crowd, on the metro and around the stations, rather than to their home or their person. Assault outside the family, at 52.7 against 31.6, runs above the national rate but is concentrated in nightlife hours and nightlife places.
- Theft from the person per 10,000 residents451.2SSMSI, base statistique communale de la délinquance enregistrée, 2025, indicator vols sans violence contre des personnes, summed over the twenty Paris arrondissements (75101-75120) and divided by their summed INSEE population of 2,103,778. The national comparator, 91.0, is computed from the DEPARTMENTAL base over all 68,350,798 residents, not from the communal base: the communal file suppresses small communes and covers only 53.1 million people, so a national rate computed from it is wrong and would have understated the gap, 2025
- Home burglary per 1,000 dwellings5.1Same source and year, indicator cambriolages de logement. Note the denominator: SSMSI rates burglary per 1,000 DWELLINGS (insee_log), not per resident, and its published taux_pour_mille for this indicator is on that basis. France is 5.6, so Paris is slightly BELOW the national rate on the crime people most often ask about. Carried deliberately beside the theft figure, because a city that is five times the national rate for one and below it on the other is not described by a single number. Never print this beside a per-resident rate, 2025
- Physical violence inside the family per 10,000 residents29.8Same source and year, indicator violences physiques intrafamiliales. France is 37.6, computed from the DEPARTMENTAL base which covers all 68.4 million residents; the communal base gives 39.9 but omits suppressed small communes and must not be used for a national comparator. Paris runs below the national rate either way. This indicator counts victims rather than offences, which is why it is never added to the others, 2025
The four indicators these pages carry are counted in three different units, so they are never summed into a total: burglary and unarmed robbery count an infraction, assault and sexual violence count a victim, and theft from the person counts a victime entendue. France publishes no single total recorded offences figure of the kind used for Greece or Sweden, and constructing one by addition would be adding victims to offences. Street theft dominates the Paris profile, concentrated on the metro, around Gare du Nord and Gare de l'Est, and in the tourist crowds of the 1er, 4e and 6e. Burglary is a suburban and provincial pattern more than a Paris one: a fourth-floor flat behind a coded door and an interphone is a harder target than a house with a garden.
Two cautions about the per-district table on each page. These figures count offences recorded by the police and gendarmerie, so they move with reporting as well as with crime, and pickpocketing in particular is under-reported by visitors who are gone the next day, which pushes the true street-theft gap wider rather than narrower. More importantly the denominator is residents. Central Paris is not mainly its residents: the 10e holds two mainline stations and the 4e holds the Marais and the Hôtel de Ville, so a rate computed over the people who sleep there divides a citywide throughput by a small resident base. That is why Canal Saint-Martin shows 917.1 thefts per 10,000 and Belleville 201.8, and the difference is partly real and partly arithmetic. Every district page says so on the page rather than in a footnote.
SSMSI (Service statistique ministériel de la sécurité intérieure), bases statistiques communale et départementale de la délinquance enregistrée par la police et la gendarmerie nationales, reference year 2025, published via data.gouv.fr. Paris is one of only three communes France splits into arrondissements in this base (with Lyon and Marseille), which is why per-district crime exists here at all: Zurich is the only other city on this site with a genuine per-district figure. Denominators are the INSEE populations shipped in the same file. Le Marais spans the 3e and the 4e and is computed on summed counts over summed population, never as an average of two rates